Negative Pressure Wound Therapy Market: Growth, Size, Share, and Trends

Report Code MD 6656
Published in May, 2025, By MarketsandMarkets™
Download PDF

Choose License Type

Buy Report Now Inquire Before Buying

Negative Pressure Wound Therapy Market by Product (Conventional, Single-use NPWT, Consumables, Accessories), Wound Type (Burns, Surgical, Traumatic, Diabetic Foot, Pressure, Venous Leg Ulcers), End User (Hospitals, Homecare) - Global Forecast to 2030

Overview

The global negative pressure wound therapy market, valued at US$2.59 billion in 2024, stood at US$2.76 billion in 2025 and is projected to advance at a resilient CAGR of 6.9% from 2025 to 2030, culminating in a forecasted valuation of US$3.84 billion by the end of the period. The increasing prevalence of diabetes, rising cases of traumatic injuries and burn injuries and growing geriatric population drives market growth. Rise in the chronic wound numbers has also facilitated the market. Additionally, favorable government and industry initiatives and reimbursement scene are expected to impact market growth. The growth potential of emerging countries and cost effectiveness of negative pressure wound therapy products also poses an opportunistic factor for market growth.

Negative Pressure Wound Therapy Market – Global Forecast and Key Opportunities to 2030

Attractive Opportunities in the Negative Pressure Wound Therapy Market

Asia Pacific

Market growth in the Asia Pacific can be attributed to the rising prevalence of diabetes and an increasing number of R&D investments. Additionally, an increased presence of biomedical companies also contributes to the regional market growth.

The growth of the Asia Pacific negative pressure wound therapy market can be attributed to the increasing prevalence of chronic wounds, such as burns and traumatic injuries.

Companies in the NPWT market are expanding their portfolios in negative pressure wound therapy, driven by rising demand for efficient healing and advanced wound care solutions.

The Asia Pacific is the fastest-growing region in the negative pressure wound therapy market. The regional market is projected to reach USD 542.03 million by 2030, at a CAGR of 9.5% during the forecast period.

Key players in the negative pressure wound therapy market pursue product launches, expansions, and partnerships.

Global Negative Pressure Wound Therapy Market Dynamics

DRIVER: Increasing cases of traumatic injuries

Growing number of road accidents has led to traumatic injuries that need negative pressure wound care products. These issues slow down the healing process and increase the risk of tissue damage. According to a report from January 2022 by NCBI, Brazil has about 40,000 road traffic deaths every year, making it one of the top five countries for traffic-related fatalities.

These severe accidents leads to traumatic injuries that often require advanced treatments and targeted wound care products like negative pressure wound therapy devices that are vital for keeping wounds in a controlled environment and helping them heal faster compared to other solutions for the patient.

There are other countries too with high road traffic accident rates such as India, China, and the US that are also witnessing a rise in demand for NPWT products. These countries with others are investing in trauma care clinics and infrastructure and adopting advanced wound management solutions to address the rising burden of trauma related injuries. As a result, healthcare systems are increasingly incorporating NPWT devices into standard treatment protocols, further driving market growth on a global scale for the negative pressure wound therapy market.

RESTRAINT: High cost of negative pressure wound therapy devices

The high cost of chronic wound solutions and negative pressure wound therapy products can be a restrain for long-term use, especially in cost sensitive markets where the households have a low income. In these regions, patients and healthcare providers often turn to more affordable options due to budget limitations and limited insurance coverage. An article published in Advances in Wound Care found that wounds that are chronic non healing type that target around 1% to 2% of the population, treating this wound type can go up to around USD 50 million annually. Foot ulcers, particularly common among people with diabetes, affect about 25% of the diabetic population and are a leading cause of hospitalization, contributing to high healthcare costs. As awareness grows about the benefits of negative pressure wound therapy and disposable incomes rise in many countries, the adoption of these products is expected to increase.


OPPORTUNITY: Growing usage of simplified single-use devices

One of the key opportunities in the negative pressure wound therapy market is the growing use and need of simplified, single-use NPWT devices. These devices are easy to use that are built for outpatients, it offers an effective alternative to traditional, more complex NPWT machines typically used in hospitals. As the patients find ways to reduce hospital stays and manage overall expense, single-use NPWT devices provide a practical solution for patients who can carry on with their wound care treatment at home without compromising clinical outcomes.

These devices are pre-set, require minimal training, and eliminate the need for regular maintenance or device returns, which is particularly beneficial in remote or resource-limited areas. These portable and convenience devices are popular for managing post-surgical wounds, diabetic foot ulcers, pressure ulcers and other chronic wounds in homecare settings. Patients also prefer them due to their advanced design, lightweight structure, and ease for mobility, which improves comfort during recovery. Medical device companies are engaging in this trend by expanding their single-use product lines and securing regulatory approvals in the negative pressure wound therapy market.

CHALLENGES: Limited awareness among healthcare providers

In countries with lower income like Afghanistan, and African countries, many people suffer delays in getting chronic wound properly diagnosed. This is often caused due to a lack of proper medical guidance, limited access to advanced healthcare, the healthcare faculties not being up to date with the rising technologies, and low awareness about the dangers of slow healing wounds. Without receiving timely treatment, complications can be escalated to worsen the situation, making recovery more difficult and putting added strain on healthcare systems. Medical assistance may be delayed in these areas because many people may not be able to identify the early warning symptoms of wound complications.

As a result, poor wound care becomes widespread, leading to longer recovery periods, a higher risk of infection, more expensive therapy, and a general deterioration in patient health. The effects might be more severe for people with long term health issues like diabetes, which can result in serious infections or amputations. Timely diagnosis and treatment can lower the burden on healthcare system in these countries, by reducing complications and improving healing. Thus, this issue requires more educational campaigns, easier access to medical treatments and adoption of standard wound care procedures.

Global Negative Pressure Wound Therapy Market Ecosystem Analysis

The ecosystem market map of the negative pressure wound therapy market comprises the elements present in this market, and these elements are defined with a demonstration of the bodies involved. Product Manufactures of negative pressure wound therapy include organizations involved in research, product development, optimization, and launch. In order to get items to end users—such as homecare settings, hospitals, and other healthcare facilities, who use negative pressure wound therapy products for treatments of burns and surgical & open wounds, pressure ulcers, diabetic foot ulcers, venous leg ulcers, and traumatic wounds. Regulatory agencies keep an eye on the safety, quality, and conformity to industry standards of products.

Negative Pressure Wound Therapy Market Ecosystem
 

By product type, the conventional NPWT devices segment commanded the largest market share in 2024.

The negative pressure wound therapy market is segmented into conventional NPWT devices, single-use NPWT devices, and NPWT accessories & consumables for product type. In 2024, the conventional NPWT devices accounted for the larger share of this market. One of the main features of the conventional NPWT devices is their ability to deliver maintained customizable pressure levels and continuous therapy, this helps tailor treatment to every patient’s specific needs. These devices are also equipped with features like bigger canisters for managing high exudate wounds, which helps in the long-term wound management. This makes them useful in hospitals and intensive care settings where close monitoring by the healthcare faculties is needed.

Another reason for their lead in the market is the volume of clinical evidence supporting their use. Reports and studies have noticed that conventional NPWT systems can reduce healing time, reduce infection risk, and improve patient recovery, particularly in severe or chronic wounds. This track record has built strong clinician trust and led to their continued use as a standard of care in many hospitals.

By end user, hospitals held the largest market share in 2024.

Based on end user, the negative pressure wound therapy market is divided into home care settings, hospitals, and other end users. Among these, hospitals hold the largest market share in 2024. The need for negative pressure wound therapy products in hospital has been further stimulated by the rising incidence of pressure ulcers, traumatic wounds and post operative wounds. Hospital visits for wound care have also increased as a result of the growing number of elderly population with chronic illnesses including diabetes and vascular diseases such as diabetes and foot ulcers. Hospitals and clinics can treat wounds quickly and effectively due to established wound care protocols, knowledgeable medical staff, and a wide range of NPWT products. They can observe the patients closely for the conventional NPWT devices. As a result of the increased focus on improving wound care practices and patient recovery rates, this market segment continues to hold its dominant position.

North America holds the largest market in 2024.

The North America pressure wound therapy market is steadily expanding due to factors like geriatric population, rising healthcare costs, and a growing incidence of chronic wounds.

As the number of surgeries, road accidents, and burn cases take place, there is an increasing need for effective wound care therapies such as negative pressure wound therapy.

The US comprises leading market players for the negative pressure wound therapy market. Canada has also seen a significant rise in the wound injuries which facilitates the market. As North America consists of high-income countries the adoption of the NPWT products are also observed more in this region. Additionally, the growing incidence of diabetes has led to a rise in diabetic foot ulcers, highlighting the significance of proper wound care. The expansion of healthcare systems, and E-commerce has made Negative pressure wound therapy product accessible than ever. As awareness of wound care improves and healthcare services advance, the demand for negative pressure wound therapy solutions in the North America region is expected to see continued growth.

HOSPITALS: LARGEST MARKET SHARE IN NORTH AMERICA IN 2024
US: FASTEST-GROWING COUNTRY IN REGION
Negative Pressure Wound Therapy Market Region

Recent Developments of Negative Pressure Wound Therapy Market

  • Product Launch: In April 2024, Smith+Nephew (UK) introduced the RENASYS EDGE System is designed for home care patients with chronic wounds, such as ulcers.
  • Collaboration: In March 2025, Convatec Group PLC (UK) and the Wound, Ostomy, and Continence Nurses Society (US) collaborated to launch two free educational programs to improve ostomy care knowledge for healthcare professionals in 2025.
  • Expansion: In January 2025, Cardinal Health (US) opened a distribution center in Fort Worth, Texas, to support its At-Home Solutions business.
  • Acquisition: In January 2024, Cardinal Health (US) acquired Specialty Networks (US), a technology-enabled multi-specialty group purchasing and practice enhancement organization.

Key Market Players

Want to explore hidden markets that can drive new revenue in Negative Pressure Wound Therapy Market?

Scope of the Report

Report Metric Details
Market size available for years 2022-2030
Base Year Considered 2024
Forecast period 2025-2030
Forecast units Value (USD)
Segments covered Product type, Wound type, and End User
Geographies covered North America, Europe, Asia Pacific, Latin America, and the Middle East & Africa

Frequently Asked Questions(FAQ)

Which are the top industry players in the Negative Pressure Wound Therapy market?

The key players in this market are Solventum (US), Smith+Nephew (UK), Cardinal Health (US), Mölnlycke AB (Sweden), Convatec Group PLC (UK), PAUL HARTMANN AG (Germany), Avery Dennison Corporation (US), BenQ Materials Corporation (Taiwan), Double Medical Technology Inc. (China), and Carilex Medical (Taiwan).

What are some of the major drivers for this market?

The market is driven by the increasing prevalence of diabetes, a rising geriatric population, a rise in burn and trauma incidents, and favorable government initiatives.

Which products have been included in the global negative pressure wound therapy market?

The product segments include conventional NPWT devices, single-use NPWT devices, and NPWT accessories & consumables. In 2024, conventional NPWT devices held the largest market share.

Which end users have been included in the global negative pressure wound therapy market?

End-user segments include Hospitals, Home Care Settings, and Other End Users.

Which region is lucrative for the global negative pressure wound therapy market?

The Asia Pacific region is expected to witness the highest CAGR during the forecast period due to an aging population, rising healthcare costs, and a growing incidence of chronic wounds.

Personalize This Research

  • Triangulate with your Own Data
  • Get Data as per your Format and Definition
  • Gain a Deeper Dive on a Specific Application, Geography, Customer or Competitor
  • Any level of Personalization
Request A Free Customisation

Let Us Help You

  • What are the Known and Unknown Adjacencies Impacting the Negative Pressure Wound Therapy Market
  • What will your New Revenue Sources be?
  • Who will be your Top Customer; what will make them switch?
  • Defend your Market Share or Win Competitors
  • Get a Scorecard for Target Partners
Customized Workshop Request

Table of Contents

Exclusive indicates content/data unique to MarketsandMarkets and not available with any competitors.

TITLE
PAGE NO
INTRODUCTION
26
RESEARCH METHODOLOGY
31
EXECUTIVE SUMMARY
42
PREMIUM INSIGHTS
46
MARKET OVERVIEW
49
  • 5.1 INTRODUCTION
  • 5.2 MARKET DYNAMICS
    DRIVERS
    - Booming geriatric population
    - Increasing cases of traumatic injuries
    - Growing prevalence of chronic diseases
    - Rising incidence of burn injuries
    - Favorable government and industry initiatives and reimbursement policies
    RESTRAINTS
    - High cost of negative pressure wound therapy devices
    - Risks associated with use of negative pressure wound therapy products
    OPPORTUNITIES
    - Growth opportunities in emerging economies
    - Increasing use of simplified single-use devices
    CHALLENGES
    - Availability of alternative therapies
    - Limited awareness among healthcare providers
  • 5.3 TRENDS/DISRUPTIONS IMPACTING CUSTOMER BUSINESS
  • 5.4 PRICING ANALYSIS
    AVERAGE SELLING PRICE TREND, BY PRODUCT
    AVERAGE SELLING PRICE TREND, BY KEY PLAYER
    AVERAGE SELLING PRICE TREND, BY REGION
  • 5.5 VALUE CHAIN ANALYSIS
  • 5.6 SUPPLY CHAIN ANALYSIS
  • 5.7 ECOSYSTEM ANALYSIS
  • 5.8 INVESTMENT AND FUNDING SCENARIO
  • 5.9 TECHNOLOGY ANALYSIS
    KEY TECHNOLOGIES
    - Vacuum-assisted Closure (VAC) Therapy
    COMPLEMENTARY TECHNOLOGIES
    - Topical Oxygen Therapy
    ADJACENT TECHNOLOGIES
    - Hyperbaric Oxygen Therapy
  • 5.10 PATENT ANALYSIS
  • 5.11 TRADE ANALYSIS
    IMPORT DATA (HS CODE 901890)
    EXPORT DATA (HS CODE 901890)
  • 5.12 KEY CONFERENCES AND EVENTS, 2025–2026
  • 5.13 CASE STUDY ANALYSIS
    CASE STUDY 1: COMPLEX WOUND HEALING WITH TOPICAL NEGATIVE PRESSURE WOUND THERAPY
    CASE STUDY 2: NECROTIZING FASCIITIS MANAGED WITH NEGATIVE PRESSURE WOUND THERAPY FOR BETTER WOUND CLOSURE
    CASE STUDY 3: TREATMENT OF HARD-TO-HEAL WOUNDS WITH PORTABLE NEGATIVE PRESSURE WOUND THERAPY
  • 5.14 REGULATORY LANDSCAPE
    REGULATORY ANALYSIS
    - North America
    - Europe
    - Asia Pacific
    - Latin America
    - Middle East
    REGULATORY BODIES, GOVERNMENT AGENCIES, AND OTHER ORGANIZATIONS
    - North America
    - Europe
    - Asia Pacific
    - Latin America
    - Rest of the World
  • 5.15 PORTER’S FIVE FORCES ANALYSIS
    BARGAINING POWER OF SUPPLIERS
    BARGAINING POWER OF BUYERS
    THREAT OF NEW ENTRANTS
    THREAT OF SUBSTITUTES
    INTENSITY OF COMPETITIVE RIVALRY
  • 5.16 KEY STAKEHOLDERS AND BUYING CRITERIA
    KEY STAKEHOLDERS IN BUYING PROCESS
    BUYING CRITERIA
  • 5.17 IMPACT OF AI ON NEGATIVE PRESSURE WOUND THERAPY MARKET
    INTRODUCTION
    MARKET POTENTIAL OF AI IN NEGATIVE PRESSURE WOUND THERAPY MARKET
    AI USE CASES
    KEY COMPANIES IMPLEMENTING AI
    FUTURE OF AI IN NEGATIVE PRESSURE WOUND THERAPY MARKET
  • 5.18 IMPACT OF US TARIFF REGULATION ON NEGATIVE PRESSURE WOUND THERAPY MARKET
    INTRODUCTION
    KEY TARIFF RATES
    PRICE IMPACT ANALYSIS
    KEY IMPACT ON COUNTRY/REGION
    - North America
    - Europe
    - Asia Pacific
    IMPACT ON END-USE INDUSTRIES
    - Hospitals
NEGATIVE PRESSURE WOUND THERAPY MARKET, BY PRODUCT TYPE
86
  • 6.1 INTRODUCTION
  • 6.2 CONVENTIONAL NPWT DEVICES
    RISING FOCUS ON EFFECTIVE WOUND MANAGEMENT TO EXPEDITE GROWTH
  • 6.3 SINGLE-USE NPWT DEVICES
    INCREASING ADOPTION OF SINGLE-USE DEVICES IN HOME HEALTHCARE TO PROMOTE GROWTH
  • 6.4 NPWT ACCESSORIES & CONSUMABLES
    GROWING PREVALENCE OF CHRONIC WOUNDS TO DRIVE MARKET
NEGATIVE PRESSURE WOUND THERAPY MARKET, BY WOUND TYPE
97
  • 7.1 INTRODUCTION
  • 7.2 BURNS AND SURGICAL & OPEN WOUNDS
    HIGH INCIDENCE OF BURN INJURIES IN LOW AND MIDDLE-INCOME COUNTRIES TO AID GROWTH
  • 7.3 PRESSURE ULCERS
    INCREASING AGING POPULATION WORLDWIDE TO AUGMENT GROWTH
  • 7.4 DIABETIC FOOT ULCERS
    INCREASE PREVALENCE OF DIABETES TO STIMULATE GROWTH
  • 7.5 VENOUS LEG ULCERS
    RISING PREVALENCE OF OBESITY TO CONTRIBUTE TO GROWTH
  • 7.6 TRAUMATIC WOUNDS
    GROWING INCIDENCE OF TRAUMATIC INJURIES TO BOOST MARKET
NEGATIVE PRESSURE WOUND THERAPY MARKET, BY END USER
114
  • 8.1 INTRODUCTION
  • 8.2 HOSPITALS
    RISING NUMBER OF SURGERIES TO ACCELERATE GROWTH
  • 8.3 HOME CARE SETTINGS
    INCREASING HEALTHCARE EXPENDITURE TO SPEED UP GROWTH
  • 8.4 OTHER END USERS
NEGATIVE PRESSURE WOUND THERAPY MARKET, BY REGION
124
  • 9.1 INTRODUCTION
  • 9.2 NORTH AMERICA
    MACROECONOMIC OUTLOOK FOR NORTH AMERICA
    US
    - Rising regulatory approvals and favorable reimbursement policies to stimulate growth
    CANADA
    - Increasing prevalence of diabetes to support growth
  • 9.3 EUROPE
    MACROECONOMIC OUTLOOK FOR EUROPE
    UK
    - Increase in research & development activities to aid growth
    GERMANY
    - Growing prevalence of hospital-acquired infections to propel market
    FRANCE
    - Rise in healthcare budget to spur growth
    ITALY
    - Increasing national healthcare funding to favor growth
    SPAIN
    - Increasing number of surgical procedures to promote growth
    RUSSIA
    - Escalating diabetes issue to drive market
    REST OF EUROPE
  • 9.4 ASIA PACIFIC
    MACROECONOMIC OUTLOOK FOR ASIA PACIFIC
    CHINA
    - Increasing incidence of diabetic foot ulcers to encourage growth
    JAPAN
    - Evolving healthcare delivery and infrastructure landscape to fuel market
    INDIA
    - Booming medical tourism to speed up growth
    AUSTRALIA
    - Growing focus on diabetes management to drive market
    SOUTH KOREA
    - Increasing awareness and focus on advanced wound care therapies to facilitate growth
    SINGAPORE
    - Increasing healthcare spending to sustain growth
    REST OF ASIA PACIFIC
  • 9.5 LATIN AMERICA
    MACROECONOMIC OUTLOOK FOR LATIN AMERICA
    BRAZIL
    - Free healthcare services to bolster growth
    MEXICO
    - Expanding hospital infrastructure to aid growth
    REST OF LATIN AMERICA
  • 9.6 MIDDLE EAST & AFRICA
    GROWING DEMAND FOR HEALTHCARE FACILITIES TO DRIVE MARKET
    MACROECONOMIC OUTLOOK FOR MIDDLE EAST & AFRICA
COMPETITIVE LANDSCAPE
173
  • 10.1 OVERVIEW
  • 10.2 KEY PLAYER STRATEGIES/RIGHT TO WIN, 2024
    OVERVIEW OF STRATEGIES ADOPTED BY PLAYERS IN NEGATIVE PRESSURE WOUND THERAPY MARKET
  • 10.3 REVENUE ANALYSIS, 2022–2024
  • 10.4 MARKET SHARE ANALYSIS, 2024
  • 10.5 COMPANY EVALUATION MATRIX: KEY PLAYERS, 2024
    STARS
    EMERGING LEADERS
    PERVASIVE PLAYERS
    PARTICIPANTS
    COMPANY FOOTPRINT: KEY PLAYERS, 2024
    - Company footprint
    - Region footprint
    - Product type footprint
    - Wound type footprint
    - End-user footprint
  • 10.6 COMPANY EVALUATION MATRIX: STARTUPS/SMES, 2024
    PROGRESSIVE COMPANIES
    RESPONSIVE COMPANIES
    DYNAMIC COMPANIES
    STARTING BLOCKS
    COMPETITIVE BENCHMARKING: STARTUPS/SMES, 2024
    - Detailed list of key startups/SMEs
    - Competitive benchmarking of key startups/SMEs
  • 10.7 COMPANY VALUATION AND FINANCIAL METRICS
    COMPANY VALUATION
    FINANCIAL METRICS
  • 10.8 BRAND/PRODUCT COMPARISON
  • 10.9 COMPETITIVE SCENARIO
    PRODUCT LAUNCHES AND APPROVALS
    DEALS
    EXPANSIONS
    OTHER DEVELOPMENTS
COMPANY PROFILES
194
  • 11.1 KEY PLAYERS
    SOLVENTUM
    - Business overview
    - Products offered
    - Recent developments
    - MnM view
    SMITH+NEPHEW
    - Business overview
    - Products offered
    - Recent developments
    - MnM view
    CARDINAL HEALTH
    - Business overview
    - Products offered
    - Recent developments
    - MnM view
    MÖLNLYCKE AB
    - Business overview
    - Products offered
    - Recent developments
    - MnM view
    CONVATEC GROUP PLC
    - Business overview
    - Products offered
    - Recent developments
    - MnM view
    PAUL HARTMANN AG
    - Business overview
    - Products offered
    - Recent developments
    AVERY DENNISON CORPORATION
    - Business overview
    - Products offered
    - Recent developments
    BENQ MATERIALS CORPORATION
    - Business overview
    - Products offered
    - Recent developments
    ADVANCED OXYGEN THERAPY INC.
    - Business overview
    - Products offered
    - Recent developments
  • 11.2 OTHER PLAYERS
    DOUBLE MEDICAL TECHNOLOGY INC.
    CARILEX MEDICAL
    DEROYAL INDUSTRIES, INC.
    LOHMANN & RAUSCHER GMBH & CO. KG
    MEDAXIS LLC
    GENADYNE BIOTECHNOLOGIES, INC.
    DIRECT HEALTHCARE GROUP
    ALLEVA MEDICAL
    CORK MEDICAL, LLC
    PENSAR MEDICAL
    HAROMED
    GUANGZHOU RAINHOME PHARM & TECH CO., LTD.
    GUARD MEDICAL
    DATT MEDIPRODUCTS PRIVATE LIMITED
    KORAZON MEDICAL DEVICES PRIVATE LIMITED
    TRIAGE MEDITECH PVT. LTD.
APPENDIX
242
  • 12.1 DISCUSSION GUIDE
  • 12.2 KNOWLEDGESTORE: MARKETSANDMARKETS’ SUBSCRIPTION PORTAL
  • 12.3 CUSTOMIZATION OPTIONS
  • 12.4 RELATED REPORTS
  • 12.5 AUTHOR DETAILS
LIST OF TABLES
 
  • TABLE 1 NEGATIVE PRESSURE WOUND THERAPY MARKET: INCLUSIONS AND EXCLUSIONS
  • TABLE 2 NEGATIVE PRESSURE WOUND THERAPY MARKET: RISK ASSESSMENT
  • TABLE 3 POPULATION AGES 65 AND ABOVE (% OF TOTAL POPULATION), 2023
  • TABLE 4 ROAD ACCIDENT DEMOGRAPHIC, 2022
  • TABLE 5 CHINA: STATES ON DISCHARGE OF PATIENTS WITH TYPE 2 DFU IN DIFFERENT AGE GROUPS, JANUARY 2017–DECEMBER 2023
  • TABLE 6 RISKS ASSOCIATED WITH NEGATIVE PRESSURE WOUND THERAPY DEVICES
  • TABLE 7 STRATEGIC DEVELOPMENTS IN ASIA PACIFIC, 2023–2024
  • TABLE 8 AVERAGE SELLING PRICING TREND OF NEGATIVE PRESSURE WOUND THERAPY PRODUCTS, 2023–2025
  • TABLE 9 AVERAGE SELLING PRICE TREND OF NEGATIVE PRESSURE WOUND THERAPY PRODUCTS, BY KEY PLAYER, 2023–2025
  • TABLE 10 AVERAGE SELLING PRICE TREND OF NEGATIVE PRESSURE WOUND THERAPY PRODUCTS, BY REGION, 2023–2025
  • TABLE 11 NEGATIVE PRESSURE WOUND THERAPY MARKET: ROLE OF COMPANIES IN ECOSYSTEM
  • TABLE 12 NEGATIVE PRESSURE WOUND THERAPY MARKET: INNOVATIONS AND PATENT REGISTRATIONS, 2023–2024
  • TABLE 13 IMPORT DATA (HS CODE 901890), BY COUNTRY, 2020–2024 (USD MILLION)
  • TABLE 14 EXPORT DATA (HS CODE 901890), BY COUNTRY, 2020–2024 (USD MILLION)
  • TABLE 15 NEGATIVE PRESSURE WOUND THERAPY MARKET: KEY CONFERENCES AND EVENTS, 2025–2026
  • TABLE 16 TIME, COST, AND COMPLEXITY OF REGISTRATION PROCESS IN JAPAN
  • TABLE 17 NORTH AMERICA: KEY REGULATORY BODIES, GOVERNMENT AGENCIES, AND OTHER ORGANIZATIONS
  • TABLE 18 EUROPE: KEY REGULATORY BODIES, GOVERNMENT AGENCIES, AND OTHER ORGANIZATIONS
  • TABLE 19 ASIA PACIFIC: KEY REGULATORY BODIES, GOVERNMENT AGENCIES, AND OTHER ORGANIZATIONS
  • TABLE 20 LATIN AMERICA: KEY REGULATORY BODIES, GOVERNMENT AGENCIES, AND OTHER ORGANIZATIONS
  • TABLE 21 REST OF THE WORLD: KEY REGULATORY BODIES, GOVERNMENT AGENCIES, AND OTHER ORGANIZATIONS
  • TABLE 22 NEGATIVE PRESSURE WOUND THERAPY MARKET: PORTER’S FIVE FORCES ANALYSIS
  • TABLE 23 INFLUENCE OF STAKEHOLDERS ON BUYING PROCESS OF NEGATIVE PRESSURE WOUND THERAPY PRODUCTS (%)
  • TABLE 24 KEY BUYING CRITERIA FOR NEGATIVE PRESSURE WOUND THERAPY PRODUCTS
  • TABLE 25 US ADJUSTED RECIPROCAL TARIFF RATES
  • TABLE 26 NEGATIVE PRESSURE WOUND THERAPY MARKET, BY PRODUCT TYPE, 2023–2030 (USD MILLION)
  • TABLE 27 KEY COMPANIES OFFERING CONVENTIONAL NEGATIVE PRESSURE WOUND THERAPY DEVICES
  • TABLE 28 CONVENTIONAL NEGATIVE PRESSURE WOUND THERAPY DEVICES MARKET, BY REGION, 2023–2030 (USD MILLION)
  • TABLE 29 NORTH AMERICA: CONVENTIONAL NEGATIVE PRESSURE WOUND THERAPY DEVICES MARKET, BY COUNTRY, 2023–2030 (USD MILLION)
  • TABLE 30 EUROPE: CONVENTIONAL NEGATIVE PRESSURE WOUND THERAPY DEVICES MARKET, BY COUNTRY, 2023–2030 (USD MILLION)
  • TABLE 31 ASIA PACIFIC: CONVENTIONAL NEGATIVE PRESSURE WOUND THERAPY DEVICES MARKET, BY COUNTRY, 2023–2030 (USD MILLION)
  • TABLE 32 LATIN AMERICA: CONVENTIONAL NEGATIVE PRESSURE WOUND THERAPY DEVICES MARKET, BY COUNTRY, 2023–2030 (USD MILLION)
  • TABLE 33 KEY COMPANIES OFFERING SINGLE-USE NEGATIVE PRESSURE WOUND THERAPY DEVICES
  • TABLE 34 SINGLE-USE NEGATIVE PRESSURE WOUND THERAPY DEVICES MARKET, BY REGION, 2023–2030 (USD MILLION)
  • TABLE 35 NORTH AMERICA: SINGLE-USE NEGATIVE PRESSURE WOUND THERAPY DEVICES MARKET, BY COUNTRY, 2023–2030 (USD MILLION)
  • TABLE 36 EUROPE: SINGLE-USE NEGATIVE PRESSURE WOUND THERAPY DEVICES MARKET, BY COUNTRY, 2023–2030 (USD MILLION)
  • TABLE 37 ASIA PACIFIC: SINGLE-USE NEGATIVE PRESSURE WOUND THERAPY DEVICES MARKET, BY COUNTRY, 2023–2030 (USD MILLION)
  • TABLE 38 LATIN AMERICA: SINGLE-USE NEGATIVE PRESSURE WOUND THERAPY DEVICES MARKET, BY COUNTRY, 2023–2030 (USD MILLION)
  • TABLE 39 KEY COMPANIES OFFERING NEGATIVE PRESSURE WOUND THERAPY ACCESSORIES & CONSUMABLES
  • TABLE 40 NEGATIVE PRESSURE WOUND THERAPY ACCESSORIES & CONSUMABLES MARKET, BY REGION, 2023–2030 (USD MILLION)
  • TABLE 41 NORTH AMERICA: NEGATIVE PRESSURE WOUND THERAPY ACCESSORIES & CONSUMABLES MARKET, BY COUNTRY, 2023–2030 (USD MILLION)
  • TABLE 42 EUROPE: NEGATIVE PRESSURE WOUND THERAPY ACCESSORIES & CONSUMABLES MARKET, BY COUNTRY, 2023–2030 (USD MILLION)
  • TABLE 43 ASIA PACIFIC: NEGATIVE PRESSURE WOUND THERAPY ACCESSORIES & CONSUMABLES MARKET, BY COUNTRY, 2023–2030 (USD MILLION)
  • TABLE 44 LATIN AMERICA: NEGATIVE PRESSURE WOUND THERAPY ACCESSORIES & CONSUMABLES MARKET, BY COUNTRY, 2023–2030 (USD MILLION)
  • TABLE 45 NEGATIVE PRESSURE WOUND THERAPY MARKET, BY WOUND TYPE, 2023–2030 (USD MILLION)
  • TABLE 46 NEGATIVE PRESSURE WOUND THERAPY MARKET FOR BURNS AND SURGICAL & OPEN WOUNDS, BY REGION, 2023–2030 (USD MILLION)
  • TABLE 47 NORTH AMERICA: NEGATIVE PRESSURE WOUND THERAPY MARKET FOR BURNS AND SURGICAL & OPEN WOUNDS, BY COUNTRY, 2023–2030 (USD MILLION)
  • TABLE 48 EUROPE: NEGATIVE PRESSURE WOUND THERAPY MARKET FOR BURNS AND SURGICAL & OPEN WOUNDS, BY COUNTRY, 2023–2030 (USD MILLION)
  • TABLE 49 ASIA PACIFIC: NEGATIVE PRESSURE WOUND THERAPY MARKET FOR BURNS AND SURGICAL & OPEN WOUNDS, BY COUNTRY, 2023–2030 (USD MILLION)
  • TABLE 50 LATIN AMERICA: NEGATIVE PRESSURE WOUND THERAPY MARKET FOR BURNS AND SURGICAL & OPEN WOUNDS, BY COUNTRY, 2023–2030 (USD MILLION)
  • TABLE 51 NEGATIVE PRESSURE WOUND THERAPY MARKET FOR PRESSURE ULCERS, BY REGION, 2023–2030 (USD MILLION)
  • TABLE 52 NORTH AMERICA: NEGATIVE PRESSURE WOUND THERAPY MARKET FOR PRESSURE ULCERS, BY COUNTRY, 2023–2030 (USD MILLION)
  • TABLE 53 EUROPE: NEGATIVE PRESSURE WOUND THERAPY MARKET FOR PRESSURE ULCERS, BY COUNTRY, 2023–2030 (USD MILLION)
  • TABLE 54 ASIA PACIFIC: NEGATIVE PRESSURE WOUND THERAPY MARKET FOR PRESSURE ULCERS, BY COUNTRY, 2023–2030 (USD MILLION)
  • TABLE 55 LATIN AMERICA: NEGATIVE PRESSURE WOUND THERAPY MARKET FOR PRESSURE ULCERS, BY COUNTRY, 2023–2030 (USD MILLION)
  • TABLE 56 PREVALENCE OF DIABETES, 2024
  • TABLE 57 NUMBER OF ADULT PATIENTS WITH DIABETIC FOOT ULCERS, BY COUNTRY, 2023–2030 (THOUSANDS)
  • TABLE 58 NEGATIVE PRESSURE WOUND THERAPY MARKET FOR DIABETIC FOOT ULCERS, BY REGION, 2023–2030 (USD MILLION)
  • TABLE 59 NORTH AMERICA: NEGATIVE PRESSURE WOUND THERAPY MARKET FOR DIABETIC FOOT ULCERS, BY COUNTRY, 2023–2030 (USD MILLION)
  • TABLE 60 EUROPE: NEGATIVE PRESSURE WOUND THERAPY MARKET FOR DIABETIC FOOT ULCERS, BY COUNTRY, 2023–2030 (USD MILLION)
  • TABLE 61 ASIA PACIFIC: NEGATIVE PRESSURE WOUND THERAPY MARKET FOR DIABETIC FOOT ULCERS, BY COUNTRY, 2023–2030 (USD MILLION)
  • TABLE 62 LATIN AMERICA: NEGATIVE PRESSURE WOUND THERAPY MARKET FOR DIABETIC FOOT ULCERS, BY COUNTRY, 2023–2030 (USD MILLION)
  • TABLE 63 NEGATIVE PRESSURE WOUND THERAPY MARKET FOR VENOUS LEG ULCERS, BY REGION, 2023–2030 (USD MILLION)
  • TABLE 64 NORTH AMERICA: NEGATIVE PRESSURE WOUND THERAPY MARKET FOR VENOUS LEG ULCERS, BY COUNTRY, 2023–2030 (USD MILLION)
  • TABLE 65 EUROPE: NEGATIVE PRESSURE WOUND THERAPY MARKET FOR VENOUS LEG ULCERS, BY COUNTRY, 2023–2030 (USD MILLION)
  • TABLE 66 ASIA PACIFIC: NEGATIVE PRESSURE WOUND THERAPY MARKET FOR VENOUS LEG ULCERS, BY COUNTRY, 2023–2030 (USD MILLION)
  • TABLE 67 LATIN AMERICA: NEGATIVE PRESSURE WOUND THERAPY MARKET FOR VENOUS LEG ULCERS, BY COUNTRY, 2023–2030 (USD MILLION)
  • TABLE 68 NEGATIVE PRESSURE WOUND THERAPY MARKET FOR TRAUMATIC WOUNDS, BY REGION, 2023–2030 (USD MILLION)
  • TABLE 69 NORTH AMERICA: NEGATIVE PRESSURE WOUND THERAPY MARKET FOR TRAUMATIC WOUNDS, BY COUNTRY, 2023–2030 (USD MILLION)
  • TABLE 70 EUROPE: NEGATIVE PRESSURE WOUND THERAPY MARKET FOR TRAUMATIC WOUNDS, BY COUNTRY, 2023–2030 (USD MILLION)
  • TABLE 71 ASIA PACIFIC: NEGATIVE PRESSURE WOUND THERAPY MARKET FOR TRAUMATIC WOUNDS, BY COUNTRY, 2023–2030 (USD MILLION)
  • TABLE 72 LATIN AMERICA: NEGATIVE PRESSURE WOUND THERAPY MARKET FOR TRAUMATIC WOUNDS, BY COUNTRY, 2023–2030 (USD MILLION)
  • TABLE 73 NEGATIVE PRESSURE WOUND THERAPY MARKET, BY END USER, 2023–2030 (USD MILLION)
  • TABLE 74 HOSPITALS PER CAPITA, BY COUNTRY, 2025
  • TABLE 75 NEGATIVE PRESSURE WOUND THERAPY MARKET FOR HOSPITALS, BY REGION, 2023–2030 (USD MILLION)
  • TABLE 76 NORTH AMERICA: NEGATIVE PRESSURE WOUND THERAPY MARKET FOR HOSPITALS, BY COUNTRY, 2023–2030 (USD MILLION)
  • TABLE 77 EUROPE: NEGATIVE PRESSURE WOUND THERAPY MARKET FOR HOSPITALS, BY COUNTRY, 2023–2030 (USD MILLION)
  • TABLE 78 ASIA PACIFIC: NEGATIVE PRESSURE WOUND THERAPY MARKET FOR HOSPITALS, BY COUNTRY, 2023–2030 (USD MILLION)
  • TABLE 79 LATIN AMERICA: NEGATIVE PRESSURE WOUND THERAPY MARKET FOR HOSPITALS, BY COUNTRY, 2023–2030 (USD MILLION)
  • TABLE 80 NEGATIVE PRESSURE WOUND THERAPY MARKET FOR HOME CARE SETTINGS, BY REGION, 2023–2030 (USD MILLION)
  • TABLE 81 NORTH AMERICA: NEGATIVE PRESSURE WOUND THERAPY MARKET FOR HOME CARE SETTINGS, BY COUNTRY, 2023–2030 (USD MILLION)
  • TABLE 82 EUROPE: NEGATIVE PRESSURE WOUND THERAPY MARKET FOR HOME CARE SETTINGS, BY COUNTRY, 2023–2030 (USD MILLION)
  • TABLE 83 ASIA PACIFIC: NEGATIVE PRESSURE WOUND THERAPY MARKET FOR HOME CARE SETTINGS, BY COUNTRY, 2023–2030 (USD MILLION)
  • TABLE 84 LATIN AMERICA: NEGATIVE PRESSURE WOUND THERAPY MARKET FOR HOME CARE SETTINGS, BY COUNTRY, 2023–2030 (USD MILLION)
  • TABLE 85 NEGATIVE PRESSURE WOUND THERAPY MARKET FOR OTHER END USERS, BY REGION, 2023–2030 (USD MILLION)
  • TABLE 86 NORTH AMERICA: NEGATIVE PRESSURE WOUND THERAPY MARKET FOR OTHER END USERS, BY COUNTRY, 2023–2030 (USD MILLION)
  • TABLE 87 EUROPE: NEGATIVE PRESSURE WOUND THERAPY MARKET FOR OTHER END USERS, BY COUNTRY, 2023–2030 (USD MILLION)
  • TABLE 88 ASIA PACIFIC: NEGATIVE PRESSURE WOUND THERAPY MARKET FOR OTHER END USERS, BY COUNTRY, 2023–2030 (USD MILLION)
  • TABLE 89 LATIN AMERICA: NEGATIVE PRESSURE WOUND THERAPY MARKET FOR OTHER END USERS, BY COUNTRY, 2023–2030 (USD MILLION)
  • TABLE 90 NEGATIVE PRESSURE WOUND THERAPY MARKET, BY REGION, 2023–2030 (USD MILLION)
  • TABLE 91 NORTH AMERICA: KEY MACROECONOMIC INDICATORS
  • TABLE 92 NORTH AMERICA: NEGATIVE PRESSURE WOUND THERAPY MARKET, BY COUNTRY, 2023–2030 (USD MILLION)
  • TABLE 93 NORTH AMERICA: NEGATIVE PRESSURE WOUND THERAPY MARKET, BY PRODUCT TYPE, 2023–2030 (USD MILLION)
  • TABLE 94 NORTH AMERICA: NEGATIVE PRESSURE WOUND THERAPY MARKET, BY WOUND TYPE, 2023–2030 (USD MILLION)
  • TABLE 95 NORTH AMERICA: NEGATIVE PRESSURE WOUND THERAPY MARKET, BY END USER, 2023–2030 (USD MILLION)
  • TABLE 96 US: NEGATIVE PRESSURE WOUND THERAPY MARKET, BY PRODUCT TYPE, 2023–2030 (USD MILLION)
  • TABLE 97 US: NEGATIVE PRESSURE WOUND THERAPY MARKET, BY WOUND TYPE, 2023–2030 (USD MILLION)
  • TABLE 98 US: NEGATIVE PRESSURE WOUND THERAPY MARKET, BY END USER, 2023–2030 (USD MILLION)
  • TABLE 99 CANADA: ESTIMATED PREVALENCE OF DIABETES, 2023–2024
  • TABLE 100 CANADA: NEGATIVE PRESSURE WOUND THERAPY MARKET, BY PRODUCT TYPE, 2023–2030 (USD MILLION)
  • TABLE 101 CANADA: NEGATIVE PRESSURE WOUND THERAPY MARKET, BY WOUND TYPE, 2023–2030 (USD MILLION)
  • TABLE 102 CANADA: NEGATIVE PRESSURE WOUND THERAPY MARKET, BY END USER, 2023–2030 (USD MILLION)
  • TABLE 103 EUROPE: KEY MACROECONOMIC INDICATORS
  • TABLE 104 EUROPE: NEGATIVE PRESSURE WOUND THERAPY MARKET, BY COUNTRY, 2023–2030 (USD MILLION)
  • TABLE 105 EUROPE: NEGATIVE PRESSURE WOUND THERAPY MARKET, BY PRODUCT TYPE, 2023–2030 (USD MILLION)
  • TABLE 106 EUROPE: NEGATIVE PRESSURE WOUND THERAPY MARKET, BY WOUND TYPE, 2023–2030 (USD MILLION)
  • TABLE 107 EUROPE: NEGATIVE PRESSURE WOUND THERAPY MARKET, BY END USER, 2023–2030 (USD MILLION)
  • TABLE 108 UK: NEGATIVE PRESSURE WOUND THERAPY MARKET, BY PRODUCT TYPE, 2023–2030 (USD MILLION)
  • TABLE 109 UK: NEGATIVE PRESSURE WOUND THERAPY MARKET, BY WOUND TYPE, 2023–2030 (USD MILLION)
  • TABLE 110 UK: NEGATIVE PRESSURE WOUND THERAPY MARKET, BY END USER, 2023–2030 (USD MILLION)
  • TABLE 111 GERMANY: NEGATIVE PRESSURE WOUND THERAPY MARKET, BY PRODUCT TYPE, 2023–2030 (USD MILLION)
  • TABLE 112 GERMANY: NEGATIVE PRESSURE WOUND THERAPY MARKET, BY WOUND TYPE, 2023–2030 (USD MILLION)
  • TABLE 113 GERMANY: NEGATIVE PRESSURE WOUND THERAPY MARKET, BY END USER, 2023–2030 (USD MILLION)
  • TABLE 114 FRANCE: NEGATIVE PRESSURE WOUND THERAPY MARKET, BY PRODUCT TYPE, 2023–2030 (USD MILLION)
  • TABLE 115 FRANCE: NEGATIVE PRESSURE WOUND THERAPY MARKET, BY WOUND TYPE, 2023–2030 (USD MILLION)
  • TABLE 116 FRANCE: NEGATIVE PRESSURE WOUND THERAPY MARKET, BY END USER, 2023–2030 (USD MILLION)
  • TABLE 117 ITALY: NEGATIVE PRESSURE WOUND THERAPY MARKET, BY PRODUCT TYPE, 2023–2030 (USD MILLION)
  • TABLE 118 ITALY: NEGATIVE PRESSURE WOUND THERAPY MARKET, BY WOUND TYPE, 2023–2030 (USD MILLION)
  • TABLE 119 ITALY: NEGATIVE PRESSURE WOUND THERAPY MARKET, BY END USER, 2023–2030 (USD MILLION)
  • TABLE 120 SPAIN: NEGATIVE PRESSURE WOUND THERAPY MARKET, BY PRODUCT TYPE, 2023–2030 (USD MILLION)
  • TABLE 121 SPAIN: NEGATIVE PRESSURE WOUND THERAPY MARKET, BY WOUND TYPE, 2023–2030 (USD MILLION)
  • TABLE 122 SPAIN: NEGATIVE PRESSURE WOUND THERAPY MARKET, BY END USER, 2023–2030 (USD MILLION)
  • TABLE 123 RUSSIA: NEGATIVE PRESSURE WOUND THERAPY MARKET, BY PRODUCT TYPE, 2023–2030 (USD MILLION)
  • TABLE 124 RUSSIA: NEGATIVE PRESSURE WOUND THERAPY MARKET, BY WOUND TYPE, 2023–2030 (USD MILLION)
  • TABLE 125 RUSSIA: NEGATIVE PRESSURE WOUND THERAPY MARKET, BY END USER, 2023–2030 (USD MILLION)
  • TABLE 126 REST OF EUROPE: NEGATIVE PRESSURE WOUND THERAPY MARKET, BY PRODUCT TYPE, 2023–2030 (USD MILLION)
  • TABLE 127 REST OF EUROPE: NEGATIVE PRESSURE WOUND THERAPY MARKET, BY WOUND TYPE, 2023–2030 (USD MILLION)
  • TABLE 128 REST OF EUROPE: NEGATIVE PRESSURE WOUND THERAPY MARKET, BY END USER, 2023–2030 (USD MILLION)
  • TABLE 129 ASIA PACIFIC: KEY MACROECONOMIC INDICATORS
  • TABLE 130 ASIA PACIFIC: NEGATIVE PRESSURE WOUND THERAPY MARKET, BY COUNTRY, 2023–2030 (USD MILLION)
  • TABLE 131 ASIA PACIFIC: NEGATIVE PRESSURE WOUND THERAPY MARKET, BY PRODUCT TYPE, 2023–2030 (USD MILLION)
  • TABLE 132 ASIA PACIFIC: NEGATIVE PRESSURE WOUND THERAPY MARKET, BY WOUND TYPE, 2023–2030 (USD MILLION)
  • TABLE 133 ASIA PACIFIC: NEGATIVE PRESSURE WOUND THERAPY MARKET, BY END USER, 2023–2030 (USD MILLION)
  • TABLE 134 CHINA: NEGATIVE PRESSURE WOUND THERAPY MARKET, BY PRODUCT TYPE, 2023–2030 (USD MILLION)
  • TABLE 135 CHINA: NEGATIVE PRESSURE WOUND THERAPY MARKET, BY WOUND TYPE, 2023–2030 (USD MILLION)
  • TABLE 136 CHINA: NEGATIVE PRESSURE WOUND THERAPY MARKET, BY END USER, 2023–2030 (USD MILLION)
  • TABLE 137 JAPAN: NEGATIVE PRESSURE WOUND THERAPY MARKET, BY PRODUCT TYPE, 2023–2030 (USD MILLION)
  • TABLE 138 JAPAN: NEGATIVE PRESSURE WOUND THERAPY MARKET, BY WOUND TYPE, 2023–2030 (USD MILLION)
  • TABLE 139 JAPAN: NEGATIVE PRESSURE WOUND THERAPY MARKET, BY END USER, 2023–2030 (USD MILLION)
  • TABLE 140 INDIA: NEGATIVE PRESSURE WOUND THERAPY MARKET, BY PRODUCT TYPE, 2023–2030 (USD MILLION)
  • TABLE 141 INDIA: NEGATIVE PRESSURE WOUND THERAPY MARKET, BY WOUND TYPE, 2023–2030 (USD MILLION)
  • TABLE 142 INDIA: NEGATIVE PRESSURE WOUND THERAPY MARKET, BY END USER, 2023–2030 (USD MILLION)
  • TABLE 143 AUSTRALIA: NEGATIVE PRESSURE WOUND THERAPY MARKET, BY PRODUCT TYPE, 2023–2030 (USD MILLION)
  • TABLE 144 AUSTRALIA: NEGATIVE PRESSURE WOUND THERAPY MARKET, BY WOUND TYPE, 2023–2030 (USD MILLION)
  • TABLE 145 AUSTRALIA: NEGATIVE PRESSURE WOUND THERAPY MARKET, BY END USER, 2023–2030 (USD MILLION)
  • TABLE 146 SOUTH KOREA: NEGATIVE PRESSURE WOUND THERAPY MARKET, BY PRODUCT TYPE, 2023–2030 (USD MILLION)
  • TABLE 147 SOUTH KOREA: NEGATIVE PRESSURE WOUND THERAPY MARKET, BY WOUND TYPE, 2023–2030 (USD MILLION)
  • TABLE 148 SOUTH KOREA: NEGATIVE PRESSURE WOUND THERAPY MARKET, BY END USER, 2023–2030 (USD MILLION)
  • TABLE 149 SINGAPORE: NEGATIVE PRESSURE WOUND THERAPY MARKET, BY PRODUCT TYPE, 2023–2030 (USD MILLION)
  • TABLE 150 SINGAPORE: NEGATIVE PRESSURE WOUND THERAPY MARKET, BY WOUND TYPE, 2023–2030 (USD MILLION)
  • TABLE 151 SINGAPORE: NEGATIVE PRESSURE WOUND THERAPY MARKET, BY END USER, 2023–2030 (USD MILLION)
  • TABLE 152 REST OF ASIA PACIFIC: NEGATIVE PRESSURE WOUND THERAPY MARKET, BY PRODUCT TYPE, 2023–2030 (USD MILLION)
  • TABLE 153 REST OF ASIA PACIFIC: NEGATIVE PRESSURE WOUND THERAPY MARKET, BY WOUND TYPE, 2023–2030 (USD MILLION)
  • TABLE 154 REST OF ASIA PACIFIC: NEGATIVE PRESSURE WOUND THERAPY MARKET, BY END USER, 2023–2030 (USD MILLION)
  • TABLE 155 LATIN AMERICA: KEY MACROECONOMIC INDICATORS
  • TABLE 156 LATIN AMERICA: NEGATIVE PRESSURE WOUND THERAPY MARKET, BY COUNTRY, 2023–2030 (USD MILLION)
  • TABLE 157 LATIN AMERICA: NEGATIVE PRESSURE WOUND THERAPY MARKET, BY PRODUCT TYPE, 2023–2030 (USD MILLION)
  • TABLE 158 LATIN AMERICA: NEGATIVE PRESSURE WOUND THERAPY MARKET, BY WOUND TYPE, 2023–2030 (USD MILLION)
  • TABLE 159 LATIN AMERICA: NEGATIVE PRESSURE WOUND THERAPY MARKET, BY END USER, 2023–2030 (USD MILLION)
  • TABLE 160 BRAZIL: NEGATIVE PRESSURE WOUND THERAPY MARKET, BY PRODUCT TYPE, 2023–2030 (USD MILLION)
  • TABLE 161 BRAZIL: NEGATIVE PRESSURE WOUND THERAPY MARKET, BY WOUND TYPE, 2023–2030 (USD MILLION)
  • TABLE 162 BRAZIL: NEGATIVE PRESSURE WOUND THERAPY MARKET, BY END USER, 2023–2030 (USD MILLION)
  • TABLE 163 MEXICO: NEGATIVE PRESSURE WOUND THERAPY MARKET, BY PRODUCT TYPE, 2023–2030 (USD MILLION)
  • TABLE 164 MEXICO: NEGATIVE PRESSURE WOUND THERAPY MARKET, BY WOUND TYPE, 2023–2030 (USD MILLION)
  • TABLE 165 MEXICO: NEGATIVE PRESSURE WOUND THERAPY MARKET, BY END USER, 2023–2030 (USD MILLION)
  • TABLE 166 REST OF LATIN AMERICA: NEGATIVE PRESSURE WOUND THERAPY MARKET, BY PRODUCT TYPE, 2023–2030 (USD MILLION)
  • TABLE 167 REST OF LATIN AMERICA: NEGATIVE PRESSURE WOUND THERAPY MARKET, BY WOUND TYPE, 2023–2030 (USD MILLION)
  • TABLE 168 REST OF LATIN AMERICA: NEGATIVE PRESSURE WOUND THERAPY MARKET, BY END USER, 2023–2030 (USD MILLION)
  • TABLE 169 MIDDLE EAST & AFRICA: KEY MACROECONOMIC INDICATORS
  • TABLE 170 MIDDLE EAST & AFRICA: NEGATIVE PRESSURE WOUND THERAPY MARKET, BY PRODUCT TYPE, 2023–2030 (USD MILLION)
  • TABLE 171 MIDDLE EAST & AFRICA: NEGATIVE PRESSURE WOUND THERAPY MARKET, BY WOUND TYPE, 2023–2030 (USD MILLION)
  • TABLE 172 MIDDLE EAST & AFRICA: NEGATIVE PRESSURE WOUND THERAPY MARKET, BY END USER, 2023–2030 (USD MILLION)
  • TABLE 173 NEGATIVE PRESSURE WOUND THERAPY MARKET: OVERVIEW OF STRATEGIES DEPLOYED BY KEY MANUFACTURING COMPANIES, JANUARY 2022–MARCH 2025
  • TABLE 174 NEGATIVE PRESSURE WOUND THERAPY MARKET: DEGREE OF COMPETITION
  • TABLE 175 NEGATIVE PRESSURE WOUND THERAPY MARKET: REGION FOOTPRINT
  • TABLE 176 NEGATIVE PRESSURE WOUND THERAPY MARKET: PRODUCT TYPE FOOTPRINT
  • TABLE 177 NEGATIVE PRESSURE WOUND THERAPY MARKET: WOUND TYPE FOOTPRINT
  • TABLE 178 NEGATIVE PRESSURE WOUND THERAPY MARKET: END-USER FOOTPRINT
  • TABLE 179 NEGATIVE PRESSURE WOUND THERAPY MARKET: DETAILED LIST OF KEY STARTUPS/SMES
  • TABLE 180 NEGATIVE PRESSURE WOUND THERAPY MARKET: COMPETITIVE BENCHMARKING OF KEY STARTUPS/SMES
  • TABLE 181 NEGATIVE PRESSURE WOUND THERAPY MARKET: PRODUCT LAUNCHES AND APPROVALS, JANUARY 2022–MARCH 2025
  • TABLE 182 NEGATIVE PRESSURE WOUND THERAPY MARKET: DEALS, JANUARY 2022–MARCH 2025
  • TABLE 183 NEGATIVE PRESSURE WOUND THERAPY MARKET: EXPANSIONS, JANUARY 2022–MARCH 2025
  • TABLE 184 NEGATIVE PRESSURE WOUND THERAPY MARKET: OTHER DEVELOPMENTS, JANUARY 2022–MARCH 2025
  • TABLE 185 SOLVENTUM: COMPANY OVERVIEW
  • TABLE 186 SOLVENTUM: PRODUCTS OFFERED
  • TABLE 187 SOLVENTUM: PRODUCT LAUNCHES AND APPROVALS,JANUARY 2022–MARCH 2025
  • TABLE 188 SOLVENTUM: OTHER DEVELOPMENTS, JANUARY 2022–MARCH 2025
  • TABLE 189 SMITH+NEPHEW: COMPANY OVERVIEW
  • TABLE 190 SMITH+NEPHEW: PRODUCTS OFFERED
  • TABLE 191 SMITH+NEPHEW: PRODUCT LAUNCHES AND APPROVALS, JANUARY 2022–MARCH 2025
  • TABLE 192 SMITH+NEPHEW: DEALS, JANUARY 2022–MARCH 2025
  • TABLE 193 SMITH+NEPHEW: EXPANSIONS, JANUARY 2022–MARCH 2025
  • TABLE 194 CARDINAL HEALTH: COMPANY OVERVIEW
  • TABLE 195 CARDINAL HEALTH: PRODUCTS OFFERED
  • TABLE 196 CARDINAL HEALTH: DEALS, JANUARY 2022–MARCH 2025
  • TABLE 197 CARDINAL HEALTH: EXPANSIONS, JANUARY 2022–MARCH 2025
  • TABLE 198 MÖLNLYCKE AB: COMPANY OVERVIEW
  • TABLE 199 MÖLNLYCKE AB: PRODUCTS OFFERED
  • TABLE 200 MÖLNLYCKE AB: DEALS, JANUARY 2022–MARCH 2025
  • TABLE 201 CONVATEC GROUP PLC: COMPANY OVERVIEW
  • TABLE 202 CONVATEC GROUP PLC: PRODUCTS OFFERED
  • TABLE 203 CONVATEC GROUP PLC: DEALS, JANUARY 2022–MARCH 2025
  • TABLE 204 PAUL HARTMANN AG: COMPANY OVERVIEW
  • TABLE 205 PAUL HARTMANN AG: PRODUCTS OFFERED
  • TABLE 206 PAUL HARTMANN AG: DEALS, JANUARY 2022–MARCH 2025
  • TABLE 207 AVERY DENNISON CORPORATION: COMPANY OVERVIEW
  • TABLE 208 AVERY DENNISON CORPORATION: PRODUCTS OFFERED
  • TABLE 209 AVERY DENNISON CORPORATION: DEALS, JANUARY 2022–MARCH 2025
  • TABLE 210 AVERY DENNISON CORPORATION: EXPANSIONS, JANUARY 2022–MARCH 2025
  • TABLE 211 BENQ MATERIALS CORPORATION: COMPANY OVERVIEW
  • TABLE 212 BENQ MATERIALS CORPORATION: PRODUCTS OFFERED
  • TABLE 213 BENQ MATERIALS CORPORATION: DEALS, JANUARY 2022–MARCH 2025
  • TABLE 214 BENQ MATERIALS CORPORATION: OTHER DEVELOPMENTS, JANUARY 2022–MARCH 2025
  • TABLE 215 ADVANCED OXYGEN THERAPY INC.: COMPANY OVERVIEW
  • TABLE 216 ADVANCED OXYGEN THERAPY INC.: PRODUCTS OFFERED
  • TABLE 217 ADVANCED OXYGEN THERAPY INC.: PRODUCT LAUNCHES AND APPROVALS, JANUARY 2022–MARCH 2025
  • TABLE 218 DOUBLE MEDICAL TECHNOLOGY INC.: COMPANY OVERVIEW
  • TABLE 219 CARILEX MEDICAL: COMPANY OVERVIEW
  • TABLE 220 DEROYAL INDUSTRIES, INC.: COMPANY OVERVIEW
  • TABLE 221 LOHMANN & RAUSCHER GMBH & CO. KG: COMPANY OVERVIEW
  • TABLE 222 MEDAXIS LLC: COMPANY OVERVIEW
  • TABLE 223 GENADYNE BIOTECHNOLOGIES, INC.: COMPANY OVERVIEW
  • TABLE 224 DIRECT HEALTHCARE GROUP: COMPANY OVERVIEW
  • TABLE 225 ALLEVA MEDICAL: COMPANY OVERVIEW
  • TABLE 226 CORK MEDICAL, LLC: COMPANY OVERVIEW
  • TABLE 227 PENSAR MEDICAL: COMPANY OVERVIEW
  • TABLE 228 HAROMED: COMPANY OVERVIEW
  • TABLE 229 GUANGZHOU RAINHOME PHARM & TECH CO., LTD.: COMPANY OVERVIEW
  • TABLE 230 GUARD MEDICAL: COMPANY OVERVIEW
  • TABLE 231 DATT MEDIPRODUCTS PRIVATE LIMITED: COMPANY OVERVIEW
  • TABLE 232 KORAZON MEDICAL DEVICES PRIVATE LIMITED: COMPANY OVERVIEW
  • TABLE 233 TRIAGE MEDITECH PVT. LTD.: COMPANY OVERVIEW
LIST OF FIGURES
 
  • FIGURE 1 NEGATIVE PRESSURE WOUND THERAPY MARKET SEGMENTATION AND REGIONAL SCOPE
  • FIGURE 2 NEGATIVE PRESSURE WOUND THERAPY MARKET: RESEARCH DESIGN
  • FIGURE 3 BREAKDOWN OF PRIMARY INTERVIEWS: BY COMPANY TYPE, DESIGNATION, AND REGION
  • FIGURE 4 BOTTOM-UP APPROACH: COMPANY REVENUE ESTIMATION APPROACH
  • FIGURE 5 CAGR PROJECTIONS: SUPPLY-SIDE ANALYSIS
  • FIGURE 6 NEGATIVE PRESSURE WOUND THERAPY MARKET: TOP-DOWN APPROACH
  • FIGURE 7 DATA TRIANGULATION METHODOLOGY
  • FIGURE 8 NEGATIVE PRESSURE WOUND THERAPY MARKET, BY PRODUCT TYPE, 2025 VS. 2030 (USD MILLION)
  • FIGURE 9 NEGATIVE PRESSURE WOUND THERAPY MARKET, BY WOUND TYPE, 2025 VS. 2030 (USD MILLION)
  • FIGURE 10 NEGATIVE PRESSURE WOUND THERAPY MARKET, BY END USER, 2025 VS. 2030 (USD MILLION)
  • FIGURE 11 GEOGRAPHICAL SNAPSHOT OF NEGATIVE PRESSURE WOUND THERAPY MARKET, 2025–2030
  • FIGURE 12 INCREASING PREVALENCE OF DIABETES TO DRIVE MARKET
  • FIGURE 13 HOSPITALS SEGMENT AND CHINA LED ASIA PACIFIC MARKET IN 2024
  • FIGURE 14 CHINA TO RECORD HIGHEST GROWTH RATE FROM 2025 TO 2030
  • FIGURE 15 ASIA PACIFIC TO WITNESS HIGHEST GROWTH DURING FORECAST PERIOD
  • FIGURE 16 NEGATIVE PRESSURE WOUND THERAPY MARKET: DRIVERS, RESTRAINTS, OPPORTUNITIES, AND CHALLENGES
  • FIGURE 17 NEGATIVE PRESSURE WOUND THERAPY MARKET: TRENDS AND DISRUPTIONS IMPACTING CUSTOMER BUSINESS
  • FIGURE 18 NEGATIVE PRESSURE WOUND THERAPY MARKET: VALUE CHAIN ANALYSIS
  • FIGURE 19 NEGATIVE PRESSURE WOUND THERAPY MARKET: SUPPLY CHAIN ANALYSIS
  • FIGURE 20 NEGATIVE PRESSURE WOUND THERAPY MARKET: ECOSYSTEM ANALYSIS
  • FIGURE 21 NEGATIVE PRESSURE WOUND THERAPY MARKET: INVESTMENT AND FUNDING SCENARIO, 2019–2025
  • FIGURE 22 NEGATIVE PRESSURE WOUND THERAPY MARKET: PATENT ANALYSIS, JANUARY 2015–DECEMBER 2024
  • FIGURE 23 NEGATIVE PRESSURE WOUND THERAPY MARKET: PORTER’S FIVE FORCES ANALYSIS
  • FIGURE 24 INFLUENCE OF STAKEHOLDERS ON BUYING PROCESS OF NEGATIVE PRESSURE WOUND THERAPY PRODUCTS
  • FIGURE 25 KEY BUYING CRITERIA FOR NEGATIVE PRESSURE WOUND THERAPY PRODUCTS
  • FIGURE 26 AI USE CASES
  • FIGURE 27 NORTH AMERICA: NEGATIVE PRESSURE WOUND THERAPY MARKET SNAPSHOT
  • FIGURE 28 ASIA PACIFIC: NEGATIVE PRESSURE WOUND THERAPY MARKET SNAPSHOT
  • FIGURE 29 NEGATIVE PRESSURE WOUND THERAPY MARKET: REVENUE ANALYSIS OF KEY PLAYERS, 2022–2024
  • FIGURE 30 NEGATIVE PRESSURE WOUND THERAPY MARKET SHARE ANALYSIS OF KEY PLAYERS, 2024
  • FIGURE 31 RANKING OF KEY PLAYERS IN NEGATIVE PRESSURE WOUND THERAPY MARKET, 2024
  • FIGURE 32 NEGATIVE PRESSURE WOUND THERAPY MARKET: COMPANY EVALUATION MATRIX (KEY PLAYERS), 2024
  • FIGURE 33 NEGATIVE PRESSURE WOUND THERAPY MARKET: COMPANY FOOTPRINT
  • FIGURE 34 NEGATIVE PRESSURE WOUND THERAPY MARKET: COMPANY EVALUATION MATRIX (STARTUPS/SMES), 2024
  • FIGURE 35 YEAR-TO-DATE (YTD) PRICE TOTAL RETURN AND 5-YEAR STOCK BETA OF KEY VENDORS
  • FIGURE 36 EV/EBITDA OF KEY VENDORS
  • FIGURE 37 NEGATIVE PRESSURE WOUND THERAPY MARKET: BRAND/PRODUCT COMPARATIVE ANALYSIS
  • FIGURE 38 SOLVENTUM: COMPANY SNAPSHOT (2024)
  • FIGURE 39 SMITH+NEPHEW: COMPANY SNAPSHOT (2024)
  • FIGURE 40 CARDINAL HEALTH: COMPANY SNAPSHOT (2024)
  • FIGURE 41 MÖLNLYCKE AB: COMPANY SNAPSHOT (2024)
  • FIGURE 42 CONVATEC GROUP PLC: COMPANY SNAPSHOT (2024)
  • FIGURE 43 PAUL HARTMANN AG: COMPANY SNAPSHOT (2024)
  • FIGURE 44 AVERY DENNISON CORPORATION: COMPANY SNAPSHOT (2024)
  • FIGURE 45 BENQ MATERIALS CORPORATION: COMPANY SNAPSHOT (2023)
  • FIGURE 46 ADVANCED OXYGEN THERAPY INC.: COMPANY SNAPSHOT (2024)


The study involved major activities in estimating the current market size for the negative pressure wound therapy market. Exhaustive secondary research was done to collect information on the negative pressure wound therapy industry. The next step was to validate these findings, assumptions, and sizing with industry experts across the value chain using primary research. Different approaches, such as top-down and bottom-up, were employed to estimate the total market size. After that, the market breakup and data triangulation procedures were used to estimate the market size of the segments and subsegments of the negative pressure wound therapy market.

The four steps involved in estimating the market size are:

Secondary Research

The secondary research process involves the widespread use of secondary sources, directories, databases (such as Bloomberg Businessweek, Factiva, and D&B Hoovers), white papers, annual reports, investor presentations, SEC filings of companies and publications from government sources [such as National Institutes of Health (NIH), US FDA, US Census Bureau, World Health Organization (WHO), , Global Burden of Disease Study, and Centers for Medicare and Medicaid Services (CMS) were referred to identify and collect information for the global negative pressure wound therapy market study. It was also used to obtain important information about the key players and market classification & segmentation according to industry trends to the bottom-most level and key developments related to market and technology perspectives. A database of the key industry leaders was also prepared using secondary research.

Primary Research

In the primary research process, various sources from both the supply and demand sides were interviewed to obtain qualitative and quantitative information for this report. The primary sources from the supply side include industry experts such as CEOs, vice presidents, marketing and sales directors, technology & innovation directors, and related key executives from various key companies and organizations in the negative pressure wound therapy market. The primary sources from the demand side include pharmaceutical companies, biotechnology companies, CROs, pharmacies, medical device companies, and research academics and universities. Primary research was conducted to validate the market segmentation, identify key players in the market, and gather insights on key industry trends & key market dynamics.

The following is a breakdown of the primary respondents:
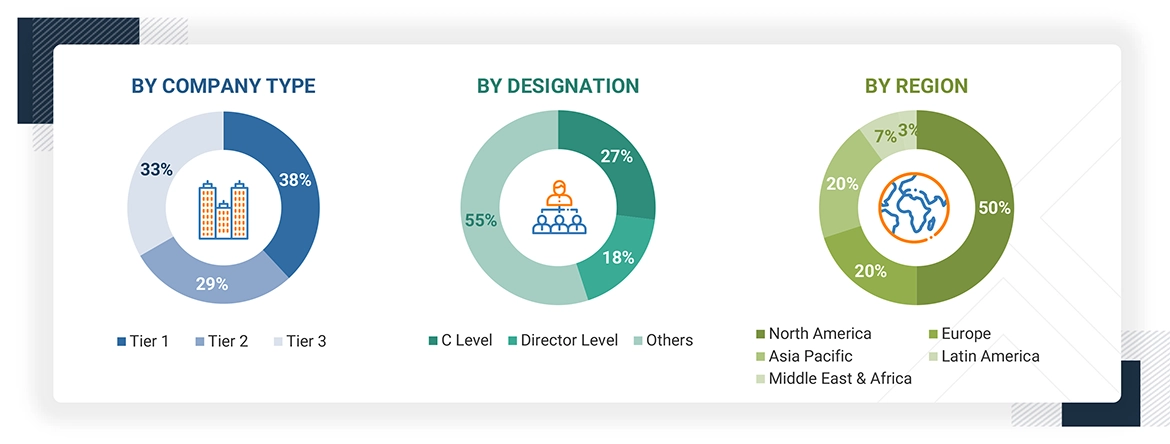
Negative Pressure Wound Therapy Market

Note 1: Other designations include sales managers, marketing managers, and product managers.

Note 2: Companies are classified into tiers based on their total revenues. As of 2024, Tier 1 = >USD 100 million, Tier 2 = USD 10 million to USD 100 million, and Tier 3 = < USD 10 million.

To know about the assumptions considered for the study, download the pdf brochure

Market Size Estimation

For the global market value, annual revenues were calculated based on the revenue mapping of major product manufacturers and OEMs active in the global negative pressure wound therapy market. All the major service providers were identified at the global and/or country/regional level. Revenue mapping for the respective business segments/sub-segments was done for the major players. The global negative pressure wound therapy market was split into various segments and sub-segments based on:

  • List of major players operating in the products market at the regional and/or country level
  • Product mapping of negative pressure wound therapy providers at the regional and/or country level
  • Mapping of annual revenue generated by listed major players from negative pressure wound therapy (or the nearest reported business unit/product category)
  • Extrapolation of the revenue mapping of the listed major players to derive the global market value of the respective segments/subsegments
  • Summation of the market value of all segments/subsegments to arrive at the global negative pressure wound therapy market

The above-mentioned data was consolidated and added with detailed inputs and analysis from MarketsandMarkets and presented in this report.

The research methodology used to estimate the market size includes the following:

Negative Pressure Wound Therapy Market

Data Triangulation

After arriving at the overall market size by applying the process mentioned above, the total market was split into several segments. To complete the overall market engineering process and arrive at the exact statistics for all segments and subsegments, data triangulation and market breakdown procedures were employed, wherever applicable. The data was triangulated by studying various factors and trends from both the demand and supply sides.

Market Definition

Negative pressure wound therapy is a treatment that pulls fluid and bacteria out of a wound to help it heal better. Some healthcare providers call it vacuum-assisted therapy. It works by creating suction. A provider can use this treatment to heal soft tissue on many different parts of your body.

Stakeholders

  • NPWT Device Manufacturers
  • Hospitals and ASCs
  • Research and Consulting Firms
  • Distributors of NPWT Devices
  • Contract Manufacturers of NPWT Devices
  • Venture Capitalists and Investors
  • Government Wound Care Organizations

Report Objectives

  • To define, describe, segment, and forecast the global negative pressure wound therapy market by product type, wound type, end user, and region
  • To provide detailed information regarding the major factors influencing market growth (such as drivers, restraints, opportunities, and challenges)
  • To analyze the micromarkets with respect to individual growth trends, prospects, and contributions to the overall negative pressure wound therapy market
  • To analyze market opportunities for stakeholders and provide details of the competitive landscape for key players
  • To forecast the size of the market segments with respect to five regions: North America, Europe, the Asia Pacific, Latin America, and the Middle East & Africa
  • To profile the key players and comprehensively analyze their product portfolios, market positions, and core competencies
  • To benchmark players within the market using the proprietary Company Evaluation Matrix framework, which analyzes market players on various parameters within the broad categories of business and product excellence
  • To study the impact of AI/Gen AI on the market, along with the macroeconomic outlook for each region


Previous Versions of this Report

Negative Pressure Wound Therapy (NPWT) Market by Type (Conventional, Disposable NPWT, Accessories, Rental & Sales Volume), Wound Type (Surgical, Traumatic, Diabetic Foot, Pressure, Venous Leg Ulcers), End-User (Hospital, Homecare) - Global Forecast to 2025

Report Code MD 6656
Published in Apr, 2020, By MarketsandMarkets™

Negative Pressure Wound Therapy (NPWT) Market by Type (Conventional, Disposable NPWT, Accessories, Rental & Sales Volume), Wound Type (Surgical, Traumatic, Diabetic Foot, Pressure, Venous Leg Ulcers), End-User (Hospital, Homecare) - Global Forecast to 2025

Report Code MD 6656
Published in Oct, 2018, By MarketsandMarkets™
"Our USP is "providing game-changing business opportunities reports with free customization" - so please feel free to provide us with your specific areas of interest / business challenges in much greater detail !!"

We appreciate your interest in this report. Once you fill out the form, you'll be immediately directed to an exclusive solution tailored to your needs. This high-value offering can help boost your revenue by 30% - a must-see opportunity for anyone looking to maximize growth.


By clicking the "Submit" button, you are agreeing to the Terms of Use and Privacy Policy.

Custom Market Research Services

We Will Customise The Research For You, In Case The Report Listed Above Does Not Meet With Your Requirements

Get 10% Free Customisation

Growth opportunities and latent adjacency in Negative Pressure Wound Therapy Market

DMCA.com Protection Status